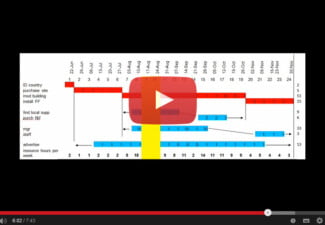
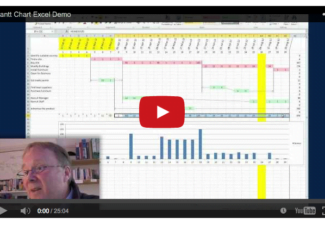
We all know that they are good for:
– communicating a plan to everyone,
– getting people to commit to doing their part before you start,
– predicting (and lobbying for) the resources that you will need before you start,
– monitoring progress by colouring in the tasks you have done,
– and working out whether an underspend is really just you being behind schedule,
……..but also how about:
- Showing a customer why they need to order NOW if they want to get delivery by their required date
- Showing a customer how much work there is / why the price is what it is / how clever your proposal is
- Showing a customer that you are good at planning and that they can trust you deliver – above other possible suppliers of the work
- Showing a customer when they need to deliver THEIR bits and what the problem will be if they don’t
- Showing a customer that if they slip their dates the project will go into a holiday period or collide with another project, so they can see that a 2 week delay by the customer could lead to say a 6 week delay to the project
- Predicting when the main spends are going to happen
- Planning when Stage Payments are likely to come in (as you complete parts of the project) so that you can plan your cash flow
Oooh, I love Gantt Charts!
PS although I recommend starting with Excel, after a while you might want a way to adjust your Gantt charts automatically, so when you move one thing it moves all the others, etc, and there is quite a bit of software around that will do this – for example, here’s a good one, and an article which also has a really good collection of additional information on Gantt charts


Very much happy to meet this side and get so very much important information and to be build to be a great leader.